Colored structures in PyMol
The pdb_prot_align.pymol_struct module contains functions that make it easy to color structures in pymol.
This example shows how to color the structure of the CoV Spike using the results created by running pdb_prot_align in the Spike CoV example. As input, specify the paths of the PDB file and the *_sites.csv file used in that example:
[1]:
pdbfile = 'input_files/6crv.pdb'
sites_csv = 'output_files/beta_coronavirus_Spike_sites.csv'
In this example, pymol is run via a Jupyter notebook as described here. This requires you to have pymol installed; see here for installation instructions. Note that you could also run the same commands inside pymol itself if you want things to be more interactive.
We import the necessary modules, which include the pymol cmd module, pdb_prot_align.colorschemes, and pdb_prot_align.pymol_struct:
[2]:
import tempfile

from IPython.display import display, Image

import pandas as pd

from pymol import cmd

import pdb_prot_align.colorschemes
import pdb_prot_align.pymol_struct
We are going to color the structure according to the number of effective amino acids, so we get the maximum number at any site to set the color scale limits (note that it would also be reasonable to color by entropy):
[3]:
max_neff = pd.read_csv(sites_csv)['n_effective'].max()
print(f"Max number of effective amino acids is {max_neff:.2f}")
Max number of effective amino acids is 7.50
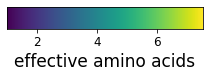
Create a ValueToColorMap to map the numerical values to colors:
[4]:
color_map = pdb_prot_align.colorschemes.ValueToColorMap(
                                minvalue=1,  # min is 1 for n effective, 0 for entropy
                                maxvalue=max_neff,
                                cmap='viridis')

_ = color_map.scale_bar(label='effective amino acids', orientation='horizontal')
Now we load the PDB, set the background to white, hide everything except the three chains of interest, and set the view to a nice orientation. This is all done using standard pymol commands:
[5]:
cmd.load(pdbfile)
cmd.bg_color('white')
cmd.hide('everything')
cmd.show('surface', 'chain A+B+C')
cmd.set_view ([  0.911516845,    0.088619262,   -0.401601136,
                 0.411251098,   -0.188872188,    0.891738057,
                 0.003175047,   -0.977994919,   -0.208603635,
                 0.000000000,    0.000000000, -443.616516113,
               164.800567627,  164.793365479,  167.758102417,
               349.750640869,  537.482421875,  -20.000000000])
PyMOL not running, entering library mode (experimental)
Next we use pdb_prot_align.pymol_struct.color_by_site to color the residues by the number of effective amino acids:
[6]:
pdb_prot_align.pymol_struct.color_by_site(cmd=cmd,
                                          sites_df=sites_csv,
                                          color_by=('n_effective', color_map),
                                          )
Now we can save an image to a PNG file using the standard pymol command. Here we save the image to a temporary file and then display it; you could also write it to a named permanent file of course:
[7]:
with tempfile.NamedTemporaryFile('w', suffix='.png') as f:
    cmd.png(f.name, ray=1)
    display(Image(f.name))
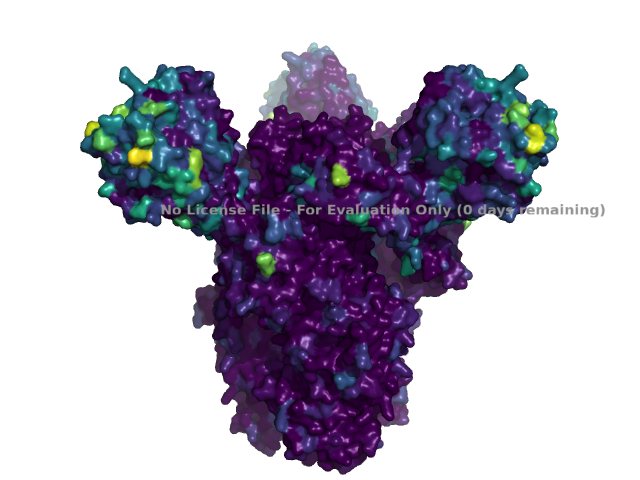
Note that if you don’t have a license file, then there will be watermark on the structure image above indicating the lack of a license.