plotnine_themes
Defines plotnine themes.
See here for details on how to use the themes for plotting: https://plotnine.readthedocs.io/en/stable/generated/plotnine.themes.theme.html
- class dms_variants.plotnine_themes.theme_graygrid(*args, **kwargs)[source]
Bases:
theme_matplotlibPlot theme with a light gray grid and axes.
Example
You can set this theme using the plotnine.theme_set command:
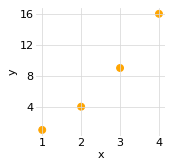
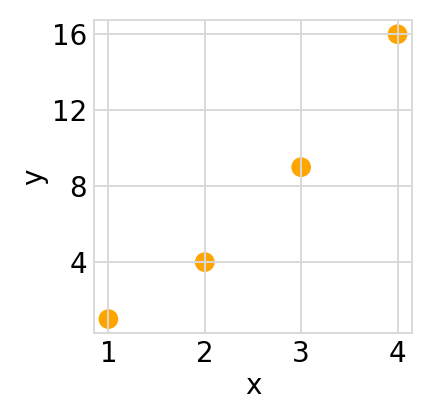
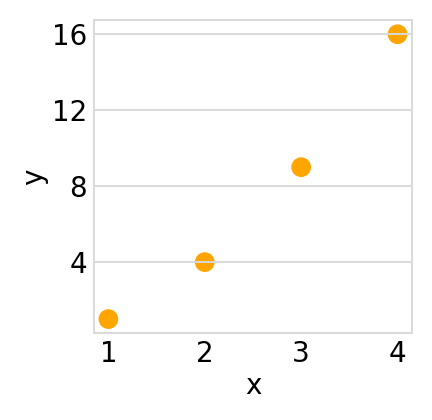
>>> import pandas as pd
>>> from plotnine import *
>>> from dms_variants.plotnine_themes import theme_graygrid
>>> df = pd.DataFrame({'x': [1, 2, 3, 4], 'y': [1, 4, 9, 16]})
>>> theme_set(theme_graygrid())
>>> p = (ggplot(df, aes('x', 'y')) +
...      geom_point(size=3, color='orange') +
...      theme(figure_size=(2, 2))
...      )
>>> _ = p.draw(show=True)
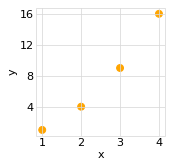
Get rid of the vertical grid lines:
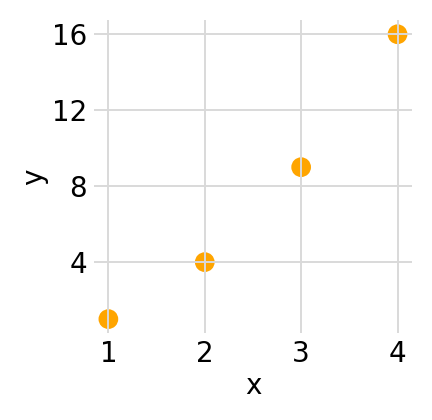
>>> p_novertgrid = p + theme(panel_grid_major_x=element_blank())
>>> _ = p_novertgrid.draw(show=True)
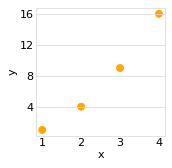
Get rid of the axes border:
>>> p_noborder = p + theme(panel_border=element_blank())
>>> _ = p_noborder.draw(show=True)


