the phydms_logoplot program
Contents
Overview
phydms_logoplot is a program that can be used to visualized amino-acid preferences or differential preferences using logo plots.
It relies on weblogo to render the actual plots.
Running phydms_logoplot with the --prefs option allows you to visualize amino-acid preferences, which you can also re-scale by the stringency parameter (\(\beta\)) inferred by phydms using the --stringency option.
Running phydms_logoplot with the --diffprefs option allows you to visualize the differential preferences inferred by phydms with the --diffprefsbysite option.
For both types of data, you can also overlay diversifying selection (inferred by phydms using --omegabysite) via the --omegabysite option.
See below for information on Command-line usage for phydms_logoplot.
Command-line usage
Make logo plot of preferences or differential preferences. Uses weblogo (http://weblogo.threeplusone.com/). The ‘phydms’ package is written by the Bloom lab (see https://github.com/jbloomlab/phydms/contributors). Version 2.4.0. Full documentation at http://jbloomlab.github.io/phydms
usage: phydms_logoplot [-h] (--prefs PREFS | --diffprefs DIFFPREFS)
                       [--stringency STRINGENCY] [--nperline NPERLINE]
                       [--numberevery NUMBEREVERY]
                       [--mapmetric {kd,mw,charge,functionalgroup}]
                       [--colormap COLORMAP] [--diffprefheight DIFFPREFHEIGHT]
                       [--omegabysite OMEGABYSITE] [--minP MINP] [-v]
                       outfile
Positional Arguments
- outfile
Name of created PDF logo plot.
Named Arguments
- --prefs
File with amino-acid preferences; same format as input to ‘phydms’.
- --diffprefs
File with differential preferences; in format output by ‘phydms’.
- --stringency
Stringency parameter to re-scale prefs.
Default: 1
Running
phydmswith an ExpCM infers a stringency parameter, \(\beta\). If you want your plotted preferences to be re-scaled by this stringency parameter, specify it here. A value of 1 corresponds to no re-scaling.- --nperline
Number of sites per line.
Default: 70
Increasing this number makes for wider and shorter plots, decreasing it makes for thinner and taller plots.
- --numberevery
Number sites at this interval.
Default: 10
- --mapmetric
Possible choices: kd, mw, charge, functionalgroup
Metric used to color amino-acid letters. kd = Kyte-Doolittle hydrophobicity; mw = molecular weight; functionalgroup = divide in 7 groups; charge = charge at neutral pH.
Default: “functionalgroup”
- --colormap
Name of matplotlib color map for amino acids when –mapmetric is ‘kd’ or ‘mw’.
Default: “jet”
- --diffprefheight
Height of diffpref logo in each direction.
Default: 1.0
When using
--diffprefs, the logo stacks will have this height in both the positive and negative direction. You will get an error if the height of a logo stack exceeds this value. Note that the maximum possible differential preference logo stack height is 1 if the preferences are completely different between the natural evolution and those provided in the site-specific amino-acid preferences file.- --omegabysite
Overlay omega on logo plot. Specify ‘*_omegabysite.txt’ file from ‘phydms’.
- --minP
Min plotted P-value for ‘–omegabysite’ overlay.
Default: 0.0001
- -v, --version
show program’s version number and exit
Output plot
phydms_logoplot prints some basic information to the screen.
But its primary output is a PDF plot that visualizes the preferences or differential preferences.
Plotting preferences
Using the --prefs option plots amino-acid preferences.
This can either be used to visualize the preferences that you are using as input to phydms, or to visualize how these preferences look after being re-scaled by the stringency parameter (\(\beta\)) inferred by phydms.
You can do this with a command like this:
phydms_logoplot --prefs prefsfile.tsv prefs_logoplot.pdf --stringency 2.99 --nperline 72 --mapmetric charge
Here is the resulting plot:
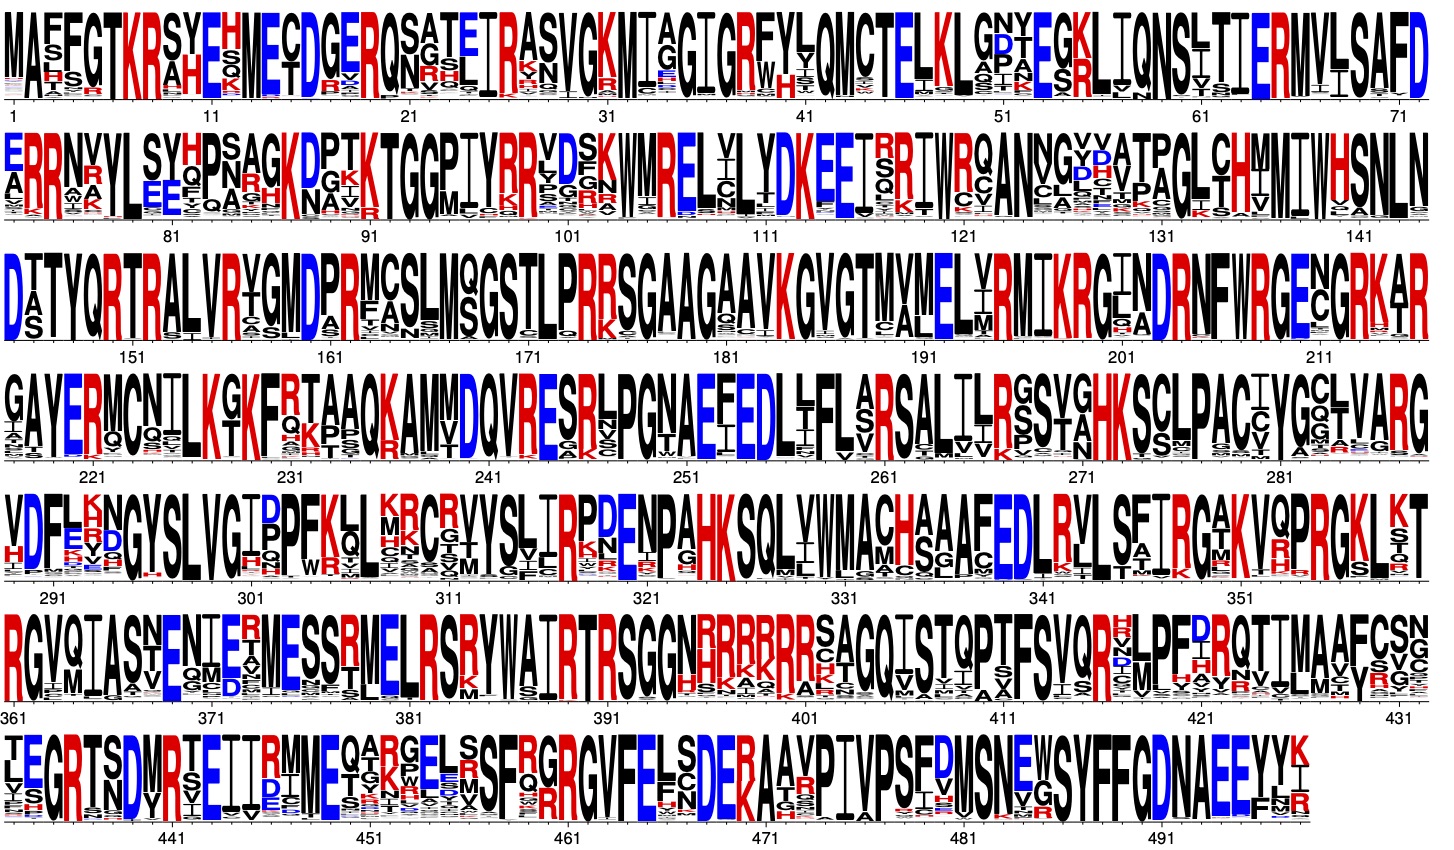
The preferences in this plot are re-scaled by the stringency parameter of \(\beta = 2.99\), which we got from the *_modelparams.txt file after running phydms.
Note that we have set --mapmetric to color amino acids by charge. They can also be colored using other schemes.
Overlaying omega values for each site
One use of phydms is to identify diversifying selection via the --omegabysite values.
You may want to overlay these data onto the logoplots of either preferences or differential preferences.
Here we overlay the diversifying selection the same preferences logo plot shown above:
phydms_logoplot --prefs prefsfile.tsv omegaoverlay_logoplot.pdf --stringency 2.99 --nperline 72 --mapmetric kd --omegabysite omegabysite.txt
where omegabysite.txt is the file produced by phydms. The created plot looks like this:
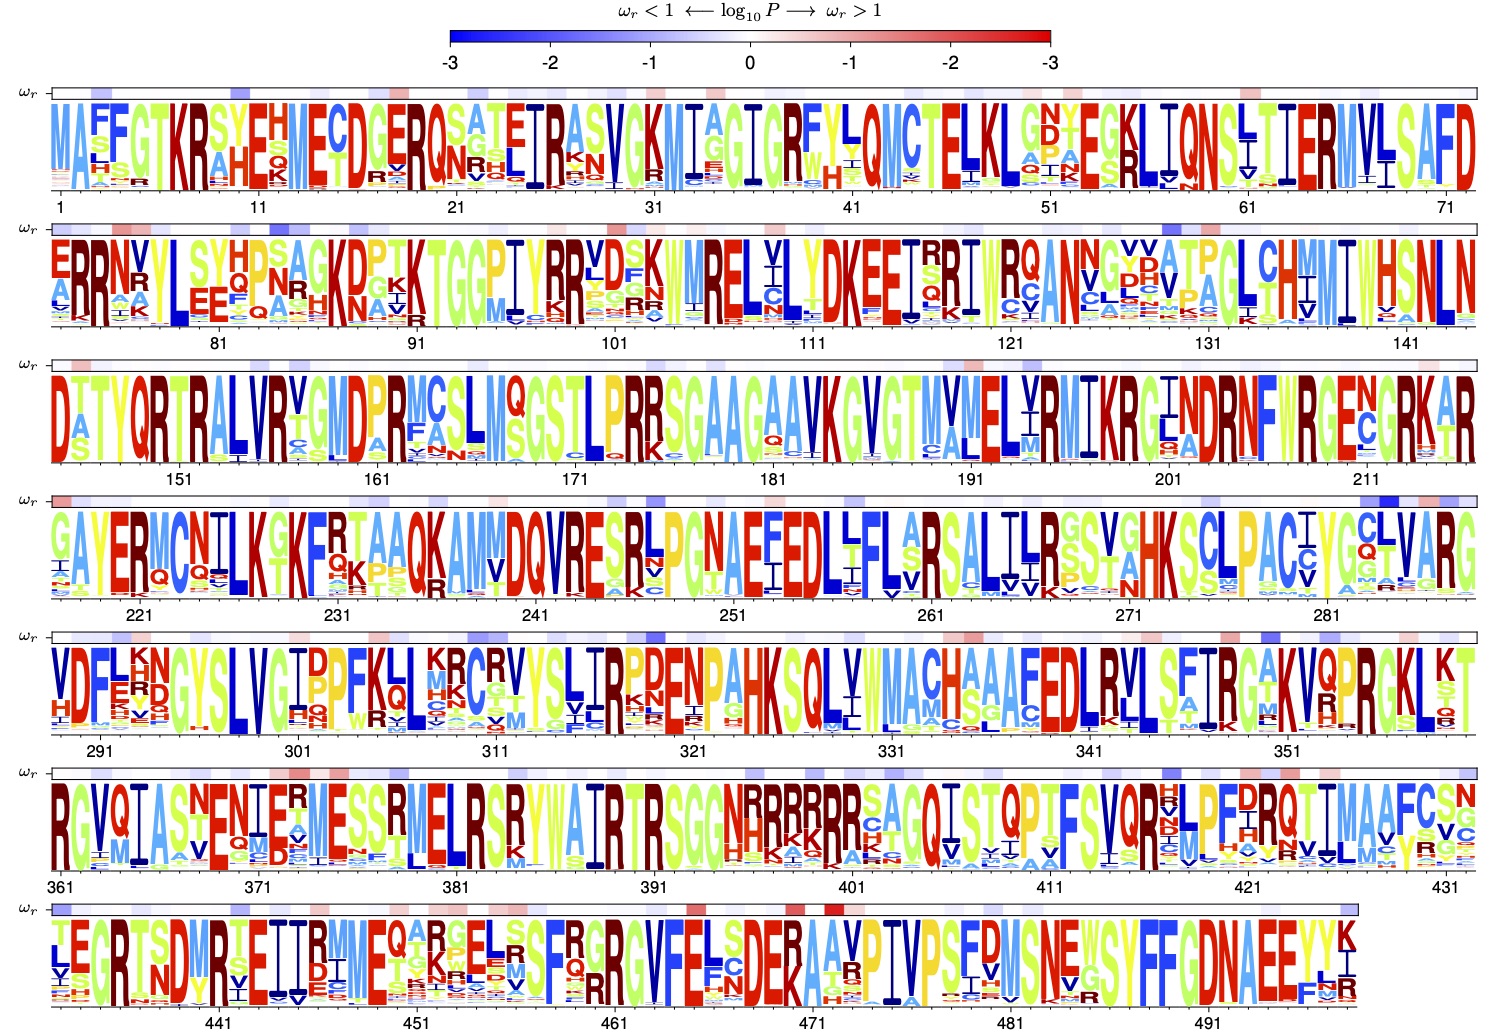
Note that the plot shows the P-value that \(\omega_r\) is greater than or less than one (recall that the P-values are more meaningful than the actual \(\omega_r\) values for this kind of analysis).
These P-values are not corrected for multiple testing (for that, look at the Q-values output by phydms).
Note also that we have used a different --mapmetric, this time coloring amino acids by hydrophobicity on the Kyte-Doolittle scale.
Plotting differential preferences
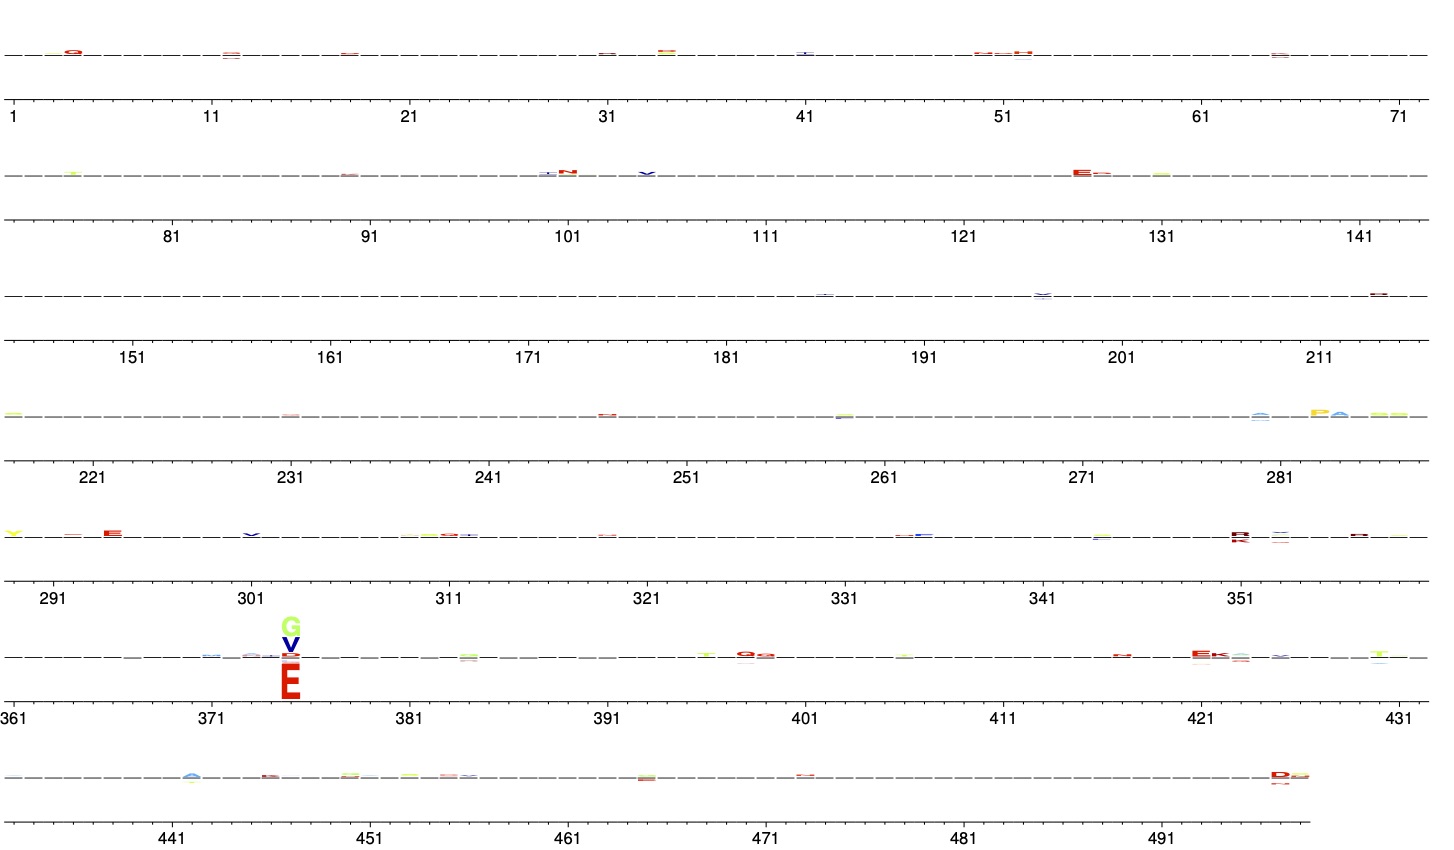
Using the --diffprefs option plots the differential amino-acid preferences that can be inferred by phydms using --diffprefsbysite.
For each site, there is a logo stack with the height of each amino-acid single-letter code proportional to the differential preference \(\Delta\pi_{r,a}\).
The y-scale is determined by --diffprefheight; note that the maximum possible height in each direction is one if the amino-acid preferences are completely shifted.
Here is an example:
phydms_logoplot --diffprefs diffprefsbysite.txt diffprefs_logplot.pdf --nperline 72